Test Index
CBSE Class 12 Chemistry 2014 Outside Delhi Set 1 Solved Paper
© examsnet.com
Question : 12 of 30
Marks:
+1,
-0
For a chemical reaction , the variation in the concentration (R) Vs. time plot is given as 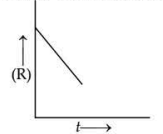 (i) Predict the order of the reaction. (ii) What is the slope of the curve?
Solution:
(i) The change in the concentration (R) vs. time (t) figure illustrated here shows a zero order reaction, for which the reaction's rate is proportional to the reactant concentration's zero power. (ii) The rate constant for a reaction with zero orders is given as, Therefore, the slope of the curve representing the fluctuation in the concentration (R) vs. time ( ) plot is opposite the reaction's rate constant.
© examsnet.com
Go to Question: