Test Index
CBSE Class 12 Physics 2014 Delhi Set 1 Paper
© examsnet.com
Question : 5 of 30
Marks:
+1,
-0
Show variation of resistivity of copper as a function of temperature in a graph.
Solution:
The variation of resistivity of copper with temperature is parabolic in nature. This is shown in the following graph: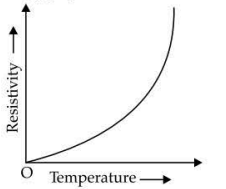
© examsnet.com
Go to Question: