Test Index
CBSE Class 12 Physics 2019 Delhi Set 1 Paper
© examsnet.com
Question : 12 of 27
Marks:
+1,
-0
Plot a graph showing variation of de Broglie wavelength associated with a charged particle of mass , versus , where is the potential difference through which the particle is accelerated. How does this graph give us the information regarding the magnitude of the charge of the particles?
Solution:
Plot of the graph showing the variation of Vs Information regarding magnitude of charge 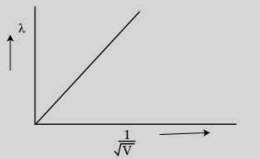
© examsnet.com
Go to Question: