Test Index
ICSE Class X Math 2013 Paper
© examsnet.com
Question : 6 of 46
Marks:
+1,
-0
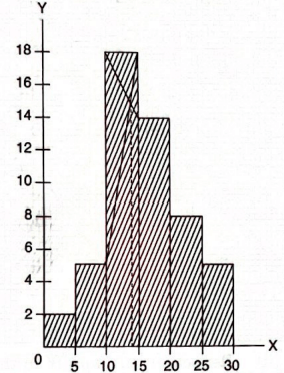
Draw a histogram from the following frequency distribution and find the mode from the graph:
| Class | 0-5 | 5-10 | 10-15 | 15-20 | 20-25 | 25-30 |
| Frequency | 2 | 5 | 18 | 14 | 8 | 5 |
Solution:
© examsnet.com
Go to Question: