Test Index
ICSE Class X Math 2014 Paper
Show Para
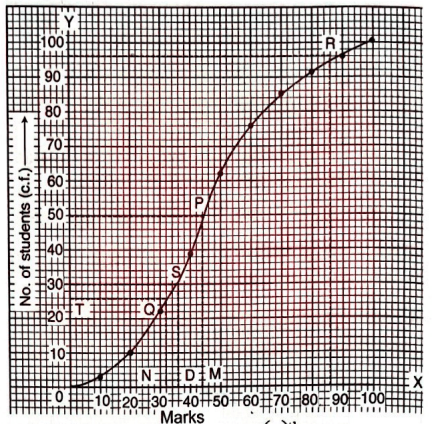
The marks obtained by 100 students in a Mathematics test are given below :
Draw an ogive for the given distribution on a graph sheet.(Use a scale of units on both axis).Use the ogive to estimate the :
| Marks | No. of Students |
|---|---|
| 0-10 | 3 |
| 10-20 | 7 |
| 20-30 | 12 |
| 30-40 | 17 |
| 40-50 | 23 |
| 50-60 | 14 |
| 60-70 | 9 |
| 70-80 | 6 |
| 80-90 | 5 |
| 90-100 | 4 |
© examsnet.com
Question : 45 of 52
Marks:
+1,
-0
median.
Solution:
| Marks | No. of Students | Cumulative frequency (c.f.) |
|---|---|---|
| 0-10 | 3 | 3 |
| 10-20 | 7 | 10 |
| 20-30 | 12 | 22 |
| 30-40 | 17 | 39 |
| 40-50 | 23 | 62 |
| 50-60 | 14 | 76 |
| 60-70 | 9 | 85 |
| 70-80 | 6 | 91 |
| 80-90 | 5 | 96 |
| 90-100 | 4 | 100 |
© examsnet.com
Go to Question: