Test Index
NCERT Class XII Chemistry
NCERT Class XII Chemistry
Chapter - Solutions
Questions with Solutions
© examsnet.com
Question : 37 of 53
Marks:
+1,
-0
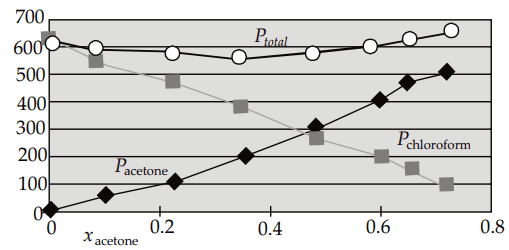
Vapour pressure of pure acetone and chloroform at 328 K are 741.8 mm Hg and 632.8 mm Hg respectively. Assuming that they form ideal solution over the entire range of composition, plot , and as a function of . The experimental data observed for different compositions of mixtures is :
Plot this data also on the same graph paper. Indicate whether it has positive deviation or negative deviation from the ideal solution.
| 0 | 11.8 | 23.4 | 36.0 | 50.8 | 58.2 | 64.5 | 72.1 | |
| 0 | 54.9 | 110.1 | 202.4 | 322.7 | 405.9 | 454.1 | 521.1 | |
| 632.8 | 548.1 | 469.4 | 359.7 | 257.7 | 193.6 | 161.2/td> | 120.7 |
Solution:
| 0.0 | 0.118 | 0.234 | 0.360 | 0.508 | 0.582 | 0.645 | 0.721 | |
| 0 | 54.9 | 110.1 | 202.4 | 322.7 | 405.9 | 454.1 | 521.1 | |
| 632.8 | 548.1 | 469.4 | 359.7 | 257.7 | 193.6 | 161.2 | 120.7 | |
| 632.8 | 603.0 | 579.5 | 562.1 | 580.4 | 599.5 | 615.3 | 641.8 |
© examsnet.com
Go to Question: