Test Index
IBPS Clerk Prelims 7-Dec-2019 Paper
Show Para
Question Numbers: 76-80 Directions: The following bar graph shows the number of children in three different societies (A, B and C) in two years i.e. 2008 and 2018. Read the graph carefully and answer the following questions.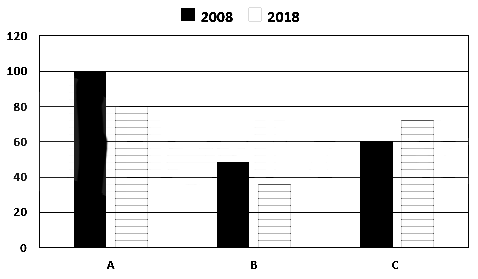
© examsnet.com
Question : 77 of 100
Marks:
+1,
-0
Go to Question: