Test Index
IBPS PO Mains 12 Oct 2025 Shift 1 Paper
Show Para
Question Numbers: 112-115Directions: Study the following pie chart carefully to answer the questions that follow.The chart and the pie-of-pie diagram represent the degree-wise distribution of the total number of projects (Private + Public) handled across four quarters: Q1, Q2, Q3, and Q4.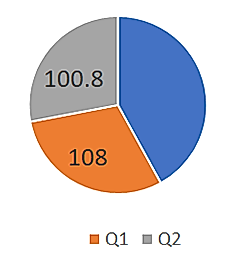
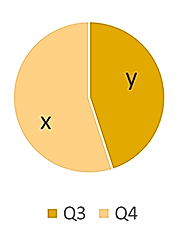 Note:The sum of the central angles in the pie-of-pie diagram is ° °≠ °.The value of x is 21.6° greater than y.The difference between the number of private and public projects in Q1 is 108.The table below shows the percentage of private projects out of the total projects handled in each quarter:
| Quarter | % of Private Projects |
|---|---|
| Q1 | 35% |
| Q2 | 3P% |
| Q3 | 50% |
| Q4 | P% |
© examsnet.com
Question : 114 of 145
Marks:
+1,
-0
Go to Question: