Test Index
IBPS PO Mains 2019 Paper for online practice
Show Para
Directions (Qs. No. 11-15): Read the following informationcarefully and answer the given questions. A survey was conducted in a school to find out whatthe students likes in their canteen for snacks. Each studentlikes only one of the following snacks. Once the surveycomplete, the survey or built the Venn diagram. 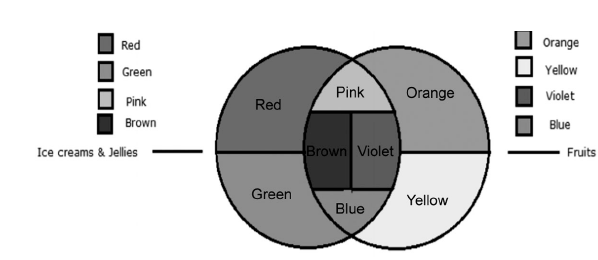 The students like one out of exactly two types offruits—apples (represented by the orange colour region inthe fruits circle) and strawberries (represented by the yellowcolour region in the fruits circle). They like one out of theice creams and jellies—ice creams (represented by the redcolour region in the circle) and jellies (represented by thegreen colour region in the circle). Some likes appleflavoured ice creams (represented by the pink colour regionin the circle). Some likes strawberry flavoured ice creams(represented by violet colour region in the circle). Somelikes apple flavoured jellies (represented by the browncolour region in the circle). Some likes strawberry flavouredjellies (represented by blue colour region in the circle). Thefollowing information also known: 1. 320 students like only fruits and 240 studentslike only ice cream (no flavoured). 2. 250 students like apples (either as fruit or flavouredice cream or flavoured jellies). 3. 180 students like only jellies (no flavoured andstudents like apple flavoured ice creams is 30more than the apple flavoured jellies. 4. Students like strawberry flavoured jellies is halfof the students like apple flavoured ice cream. 5. Students like strawberry flavoured ice cream isthrice the students like strawberry flavoured jellies. 6. Total students in the school is 1030
Go to Question: