Test Index
IBPS PO Prelims 14 Oct 2018 Solved Paper
Show Para
Question Numbers: 46-50 Directions: Consider the following graph. Bar graph shows the total population of 4 villages A, B, C, D and the table shows the ratio of men and women in these villages.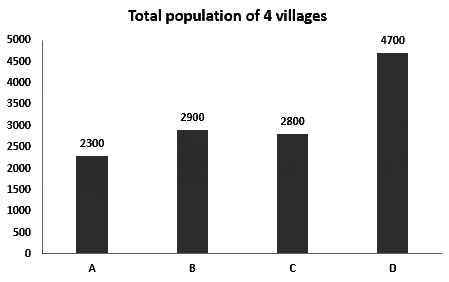 Ratio of men and women in villages.
| Men | Women | |
| A | 14 | 9 |
| B | 16 | 13 |
| C | 9 | 5 |
| D | 25 | 22 |
Go to Question: