Test Index
IBPS PO Prelims 14 Oct 2018 Solved Paper
Show Para
Question Numbers: 56-60 Directions∶ Following line graph represents the population in 6 different villages (M, N, O, P, Q and R) and the tabular column represents the ratio of literate to illiterate people and also represents the percentage of the male population.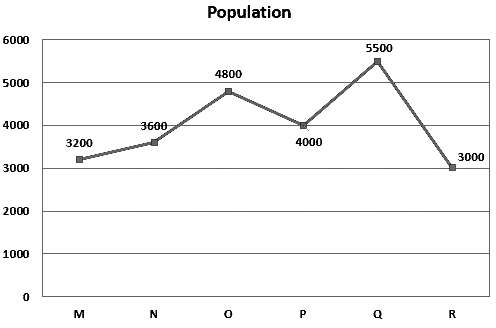
| Village | Ratio of literate to illiterate | Percentage of male population |
| M | 1 ∶ 1 | 30% |
| N | 5 ∶ 4 | 40% |
| O | 5 ∶ 7 | 40% |
| P | 3 ∶ 5 | 50% |
| Q | 2 ∶ 3 | 40% |
| R | 3 ∶ 7 | 60% |
© examsnet.com
Question : 59 of 100
Marks:
+1,
-0
Go to Question: