Test Index
IBPS PO Prelims 15 Oct 2022 Shift 2 Solved Paper
Show Para
Question Numbers: 61-65 Direction: Read the following graph carefully and answer the following questions:The following bar graph shows the quantity(in kg) of wheat, rice, pulses and salts sold by two companies P and Q in the month of January. 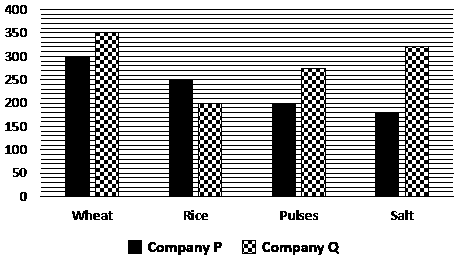
© examsnet.com
Question : 61 of 100
Marks:
+1,
-0
Go to Question: