Test Index
IBPS PO Prelims 4 Dec 2021 Shift 3 Solved Paper
Show Para
Question Numbers: 54-58 Directions: Read the given pie and table carefully and answer the following questions.The pie chart shows the percentage distribution of people who found COVID – 19 positive in four major cities of India from 1st July to 31st August 2020 and the table shows the number of people who tested positive in July from these cities.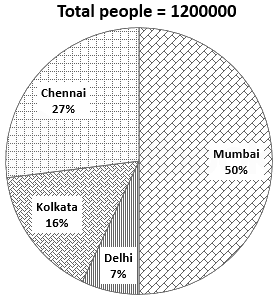
| City | July |
| Mumbai | 230068 |
| Delhi | 48149 |
| Kolkata | 83468 |
| Chennai | 147890 |
© examsnet.com
Question : 56 of 100
Marks:
+1,
-0
Go to Question: