Test Index
IBPS RRB Office Assistant 13 Aug 2023 Shift 2 Paper
Show Para
Question Numbers: 71-75 Directions: Answer the questions based on the information given below.The line graph given below shows the number of 'Spoons' and the number of 'Bowls' sold by company 'X' over the course of four distinct years.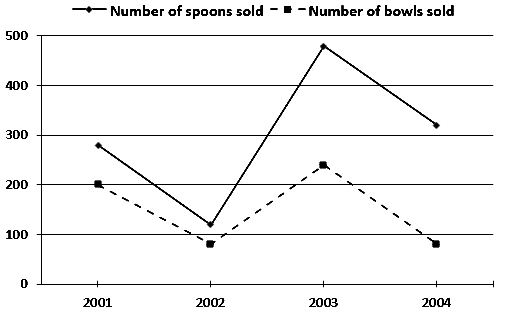
© examsnet.com
Question : 73 of 80
Marks:
+1,
-0
Go to Question: