Test Index
IBPS RRB Office Assistant 17 Aug 2019 Paper
Show Para
Question Numbers: 68-72 Directions: The bar graph provided below gives the sales of books from three booksellers A, B and C during two consecutive days i.e. Monday and Tuesday. Study the following graph carefully and answer the following question.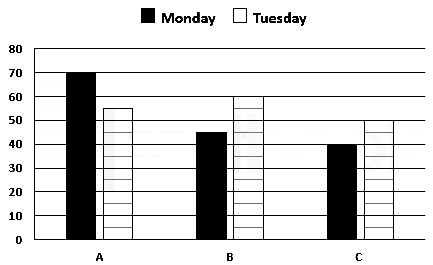
© examsnet.com
Question : 72 of 80
Marks:
+1,
-0
Go to Question: