Test Index
IBPS RRB PO Mains 10 Sep 2023 Paper
Show Para
Question Numbers: 161-165 Directions: The given pie chart shows the percentage distribution of the number of students (Boys + Girls) studying in five different schools such as A, B, C D and E and the table shows the percentage of number of boys students studying in the same schools. Total number of students studying = (Boys students + Girls students) = 200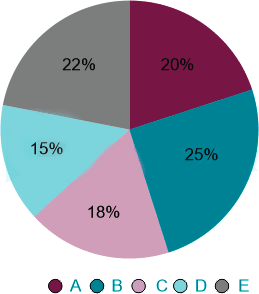 Total number of boys studying in all the school is 80
| Schools | Percentage distribution of number of boys |
| A | 15% |
| B | 35% |
| C | 10% |
| D | 25% |
| E | 15% |
© examsnet.com
Question : 161 of 200
Marks:
+1,
-0
Go to Question: