Test Index
IBPS RRB PO Mains 30 Sep 2018 Paper
Show Para
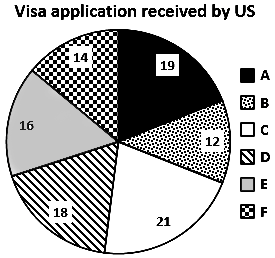
Question Numbers: 171-175 Directions: Study the graph carefully to answer the questions that follow.The following graph shows the percentage of Visa applications received by US, Mexico and Canada of various companies in a year. The total visa applications received are 2500 out of which 1500 are for US.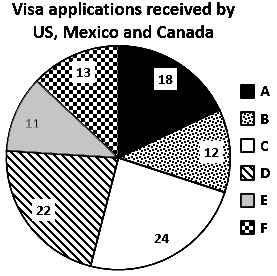
© examsnet.com
Question : 171 of 200
Marks:
+1,
-0
Go to Question: