Test Index
IBPS RRB PO Prelims 20 Aug 2022 Shift 2 Paper
Show Para
Question Numbers: 46-50 Direction: The Bar graph below shows the number of Pens of different colours produced and sold by a company. Also the selling price of different colour Pens is also shown. Study the graph carefully and answer the questions.Note: Only sold products should be considered when calculating profit.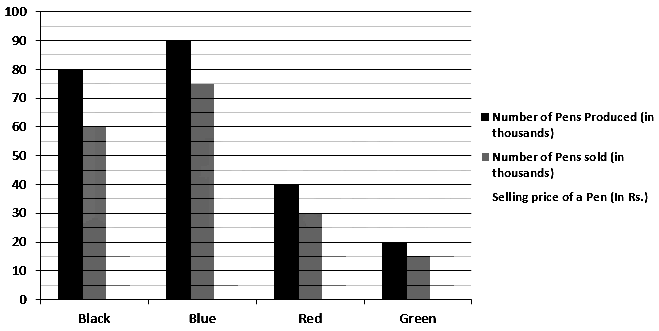
© examsnet.com
Question : 46 of 80
Marks:
+1,
-0
Go to Question: