Test Index
IBPS RRB PO Prelims 22 Nov 2025 Shift 2 Paper
Show Para
Question Numbers: 62-66Directions: Study the following pie charts carefully and answer the questions that follow.The line graph shows the number of Cupboards and Dashboards sold by four different furniture shops (A, B, C, and D) during a specific month.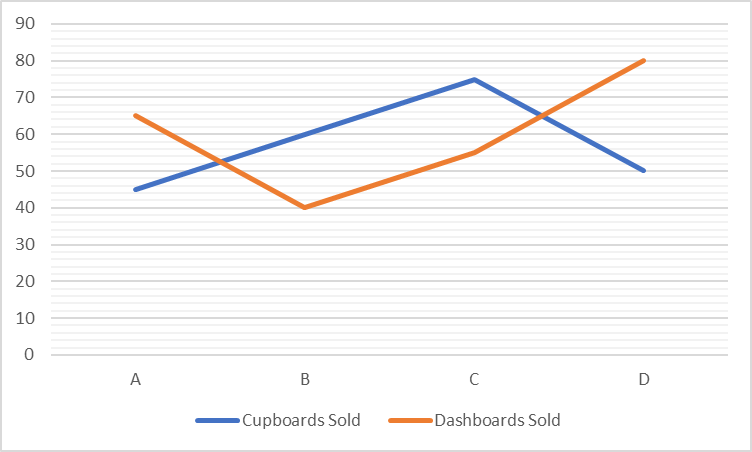
© examsnet.com
Question : 66 of 80
Marks:
+1,
-0
Go to Question: