Test Index
IBPS RRB PO Prelims 3 Aug 2024 Shift 3 Paper
Show Para
Question Numbers: 71-75 Directions: Read the data carefully and answer the following questions.The pie chart below shows the percentage distribution of total employees (Male + Female) in a company out of 2400.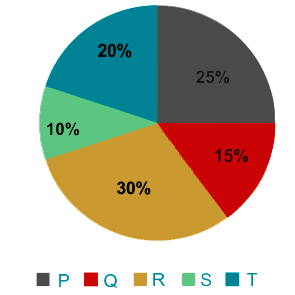 The pie chart below shows the percentage distribution of only Male employees out of 1600.
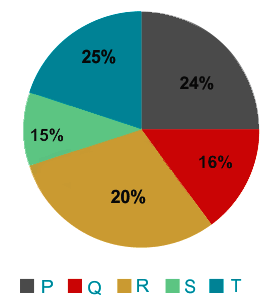
© examsnet.com
Question : 71 of 80
Marks:
+1,
-0
Go to Question: