Test Index
IBPS RRB PO Prelims 4 Aug 2024 Shift 1 Paper
Show Para
Question Numbers: 52-56 The bar graph shows the total number of students [ boys and girls] and total number of girls in five different [ A, B, C, D and E] schools.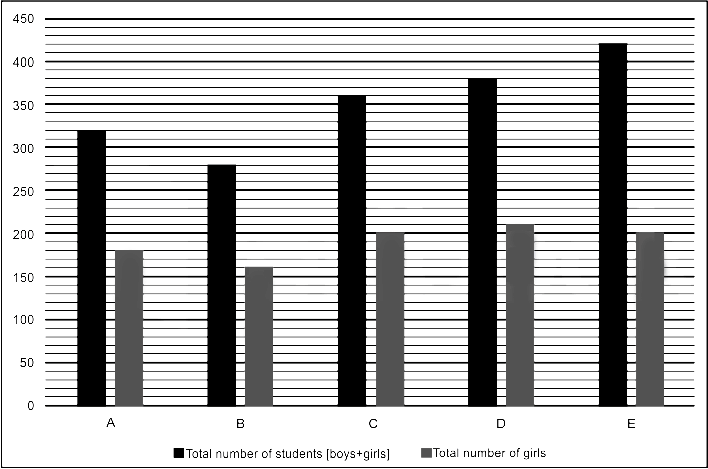
© examsnet.com
Question : 56 of 80
Marks:
+1,
-0
Go to Question: