Test Index
IBPS RRB PO Prelims 4 Aug 2024 Shift 2 Paper
Show Para
Question Numbers: 46-50 The give pie chart shows the percentage distribution of number of schools in five different cities [A, B, C, D and E].Total value of pie chart is 6000.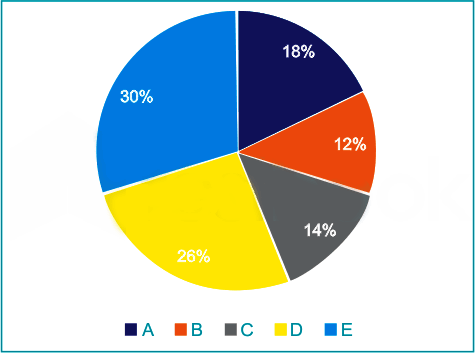
© examsnet.com
Question : 46 of 80
Marks:
+1,
-0
Go to Question: