Test Index
IBPS SO Prelims Exam Model Paper 8
Show Para
Comprehension:(Que No. 131 - 135) Directions: Read the given pie-chart carefully and answer the following questions. The pie chart given below shows the percentage distribution of the number of employees working in 6 different departments of a company.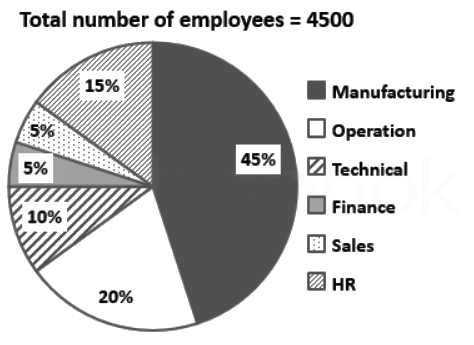
© examsnet.com
Question : 134 of 150
Marks:
+1,
-0
Go to Question: