Test Index
Indian Institute of Foreign Trade 2015 Solved Paper
Show Para
Directions for questions 57-60: Read the following information and the accompanying graphs to answer the questions that follow. www.jay.com spent 5,57,000 during last 12 months for online display advertisements, also called impressions, on five websites (Website A, Website B, Website C, Website D and Website E). In this arrangement. www.jay.com is the Destination Site, and the five websites are referred to as the Ad Sites. The allocation of online display advertising expenditure is shown in Graph A.The online display advertisements helped www.jay.com to get visitors on its site. Online visitors, visiting the Ad Sites, are served display advertisements of www.jay.com and on clicking they land on the Destination Site (Graph B). Once on the Destination Site, some of the visitors compete the purchase process (Graph C). Graph A : Allocation of Online Display Advertising Expenditure 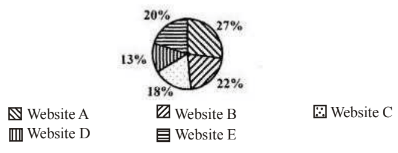 Graph B : Action at Display Websites
 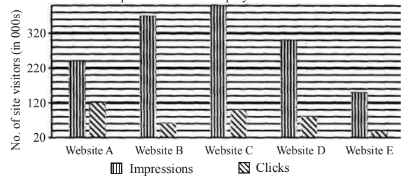 Graph C : Purchase Action at www.joy.com
 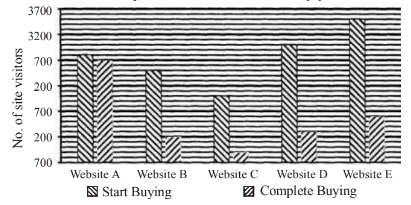 Quality traffic
Leakage in online buying
Efficiency of online display advertising expenditure on Ad Site
© examsnet.com
Question : 58 of 124
Marks:
+1,
-0
Go to Question: