Test Index
Management Aptitude Test 2016 Paper
Show Para
(Q. Nos. 126-130) These questions are based on the pie charts which represent the shift in water usage between 2011 and 2014; based on a survey conducted by Central Water Commission.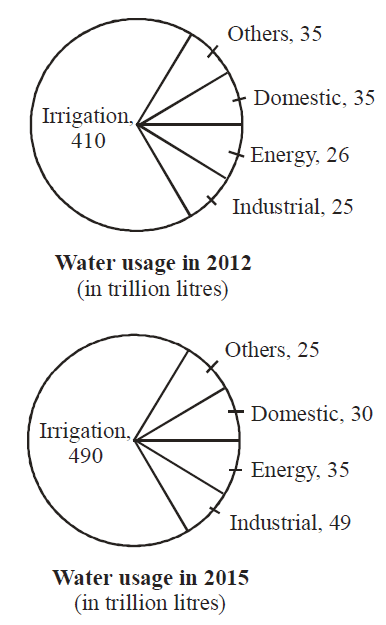
© examsnet.com
Question : 126 of 200
Marks:
+1,
-0
Go to Question: