Test Index
Management Aptitude Test 2016 Paper
Show Para
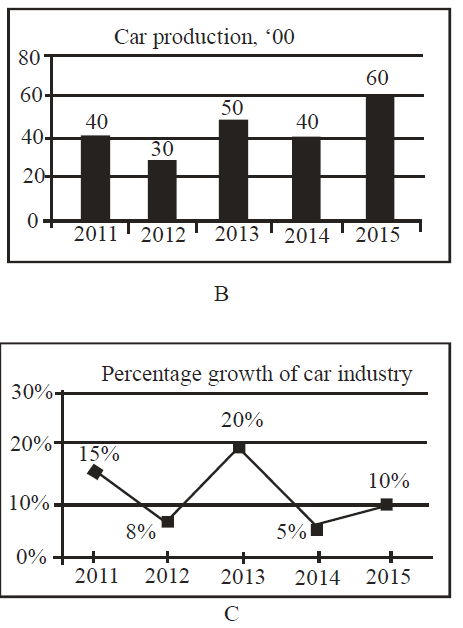
(Q. Nos. 141-145) Study the graphs to answer these questions. The graphs are related to M/s PAL, a reputed automobile company in Asia. Graph A indicates the average price per car in * lakh. Graph B represents the production in units of thousands. Graph C depicts the growth rate of the entire car industry on volume basis.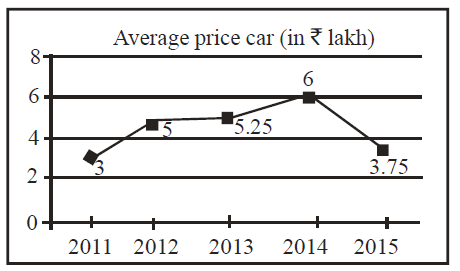
© examsnet.com
Question : 145 of 200
Marks:
+1,
-0
Go to Question: