Test Index
Management Aptitude Test Dec 2013 Paper
Show Para
(Q .N os.26 -30 ) Study the following graphs to answer these questions. The following pie chart gives the percentage of adults from various industries working in night shifts. The bar graph shows the percentage of females from these industries working in night shifts. Total number of people = 40250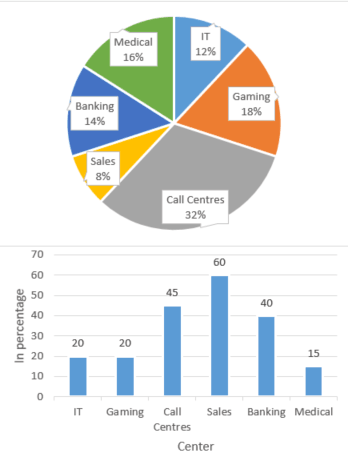
© examsnet.com
Question : 147 of 200
Marks:
+1,
-0
Go to Question: