Test Index
Management Aptitude Test Sep 2011 Paper
Show Para
Directions (Q. Nos. 151 to 155) Study the graphs to answer these questions.A farmer has been growing three different crops A, B and C. Details of yields of these crops per hectare from 2004 to 2009 are depicted in the graph. Margin of profit of these crops in ₹ per tonne are given in the table. 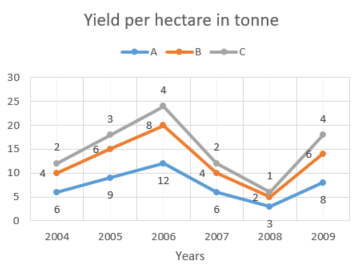 Margin of Profit in ₹ per tonnne
| Crop | 2004 | 2005 | 2006 | 2007 | 2008 | 2009 |
|---|---|---|---|---|---|---|
| A | 200 | 300 | 400 | 500 | 1000 | 800 |
| B | 300 | 400 | 500 | 600 | 1500 | 1000 |
| C | 500 | 600 | 700 | 800 | 2000 | 1500 |
© examsnet.com
Question : 155 of 200
Marks:
+1,
-0
Go to Question: