Concept:The ball moves under gravity alone, so its acceleration is constant in magnitude and directed vertically downward throughout the flight (both while going up and while coming down).
Formula:Taking upward as positive,
a=−g, so velocity follows
v=u−gt.
The slope of the
v−t graph equals the acceleration, hence the slope must stay constant and negative at every instant.
Solution:At
t=0 the ball has velocity
v=+u (thrown upward).
Velocity then decreases linearly with time, becoming zero at the highest point.
After that it becomes negative and its magnitude grows, reaching
v=−u when the ball returns to the point of projection.
Therefore the correct
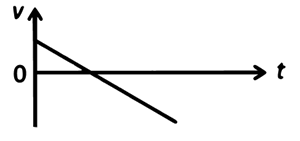
v−t graph is a single straight line starting above the
t-axis on the
v-axis, crossing the
t-axis once at the time of maximum height, and continuing below the axis with the same constant negative slope.
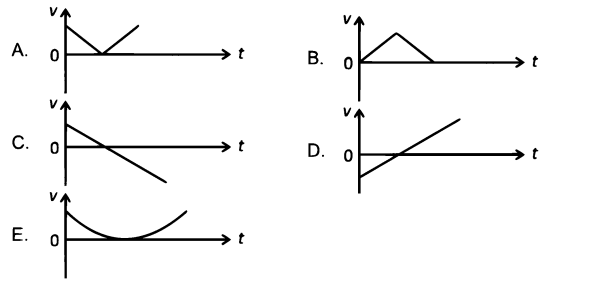
Plot C is exactly this straight line with constant negative slope, so it is correct.
Plot A shows a sudden change in slope at the point where it touches the axis (a V-shape), which would require the acceleration to change direction, so it is wrong.
Plot B keeps
v≥0 and returns to zero at the end, implying the ball never moves downward, so it is wrong.
Plot D has a constant positive slope and starts from a negative velocity, which corresponds to a different sign convention/initial condition, not to the ball thrown upward with
v=+u at
t=0, so it is wrong.
Plot E is a curved (parabolic-like) graph, which would mean a changing acceleration, whereas here
a=−g is constant, so it is wrong.
Thus only plot C correctly represents the motion.
Answer:A. C only