Test Index
Data Interpretation Practice Test 5
Show Para
Directions (46-50): Study the following pie-chart and table and answer the following questions. Percentage-wise distribution of passengers in six different trains. Total number of passengers = 8,400Percentage-wise Distribution of Passengers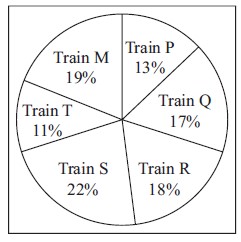
© examsnet.com
Question : 46 of 80
Marks:
+1,
-0
Go to Question: