Test Index
RRB Non Technical Model Papers 10 with solutions
Show Para
Directions (Q. 1–3):
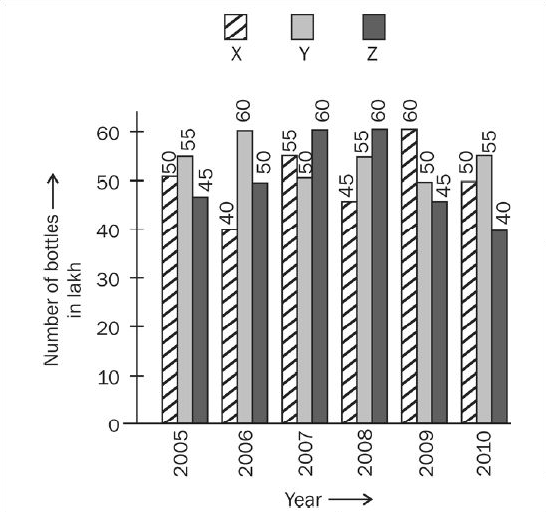
Production of three different flavours of soft drinks X, Y and Z for a period of six years has been expressed in the following graph. Study the graph and answer the questions that follow.© examsnet.com
Question : 3 of 100
Marks:
+1,
-0
Go to Question: