Test Index
RRB NTPC 2014 Paper
Show Para
Directions (Q. 50–52): Study the following graph carefully and answer the given questions.Percentage of different types of employees in a company intwo consecutive yearsTotal Number of employees = 42980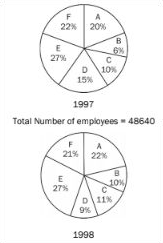
© examsnet.com
Question : 51 of 100
Marks:
+1,
-0
Go to Question: