Test Index
SBI PO 22 Nov 2021 Shift 2 Paper
Show Para
Ques No: 46-50 Directions: A survey was conducted on a group of people which consisted of 40000 people from different professions given below in the Pie-chart about the colour preference of the people. Study the pie chart and answer the questions that follow.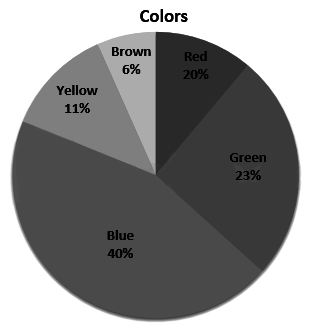
| Profession | Percentage |
| Doctor | 10 |
| Painter | 40 |
| Research Analyst | 30 |
| Professor | 20 |
Go to Question: