Test Index
SBI PO 24 June 2018 Papers
Show Para
Ques No: 44-49 Direction: The given bar graph shows the number of workers in a factory.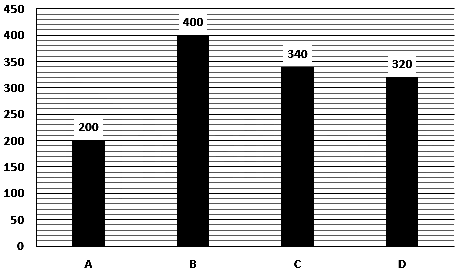
| Above the age of 40 years | |
| A | 50 |
| B | 70 |
| C | 110 |
| D | 120 |
© examsnet.com
Question : 49 of 100
Marks:
+1,
-0
Go to Question: