Test Index
SBI PO 25 June 2018 Papers
Show Para
Ques No: 56-60 Directions: Pie chart given below shows the total number of workers in three different companies A, B, and C. Given below is the ratio between officers and workers working in the company. Study the data carefully and answer the following questions: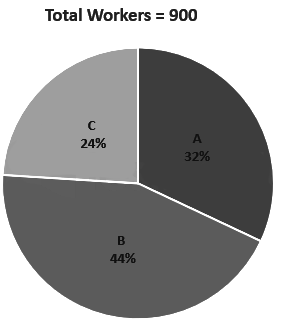
Note: total employees = Officers + Workers
| Company | Officers: Workers |
| A | 1 : 16 |
| B | 1 : 18 |
| C | 1 : 12 |
© examsnet.com
Question : 56 of 100
Marks:
+1,
-0
Go to Question: