Test Index
SBI PO 5 Jan 2021 Paper
Show Para
Direction (61 - 65) -: Read the instructions carefully and answer the questions that follow. The line-graph given below shows the number of goods produced in 5 factories(A, B, C, D, E)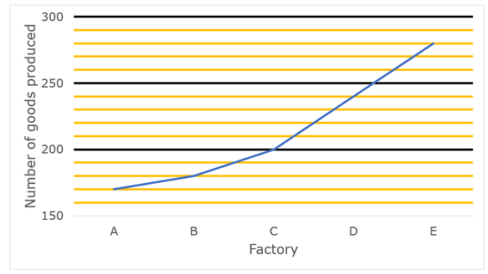 The table given below shows the percentage of goods sold in the 5 factories out of those produced in 5 factories.
| Factory | of goods sold |
|---|---|
| A | 40% |
| B | 60% |
| C | 70% |
| D | 75% |
| E | N/A |
© examsnet.com
Question : 62 of 100
Marks:
+1,
-0
Go to Question: