Test Index
SBI PO Mains Model Papers 3
Show Para
TEST – III : DATA ANALYSIS & INTERPRETATION Directions (Q. 81-85): The following pie – chart shows the distribution of the number of cars of different models produced by a Company in 2005 and 2010. 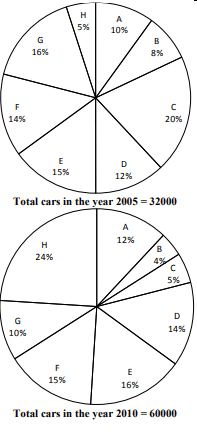
© examsnet.com
Question : 82 of 155
Marks:
+1,
-0
Go to Question: