Test Index
SBI PO Mains Model Papers 5
Show Para
Directions (Q. 111 - 115): Study the following pie chart and the table and answer the questions given below. Data of different states regarding population of states in the year 2011. 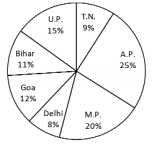
Total population of the given States = 3276000
| States | Sex and Literacy wise Population Ratio | |||
| Sex | Literacy | |||
| M | F | Literate | Illiterate | |
| A.P | 5 | 3 | 2 | 7 |
| M.P | 3 | 1 | 1 | 4 |
| Delhi | 2 | 3 | 2 | 1 |
| Goa | 3 | 5 | 3 | 2 |
| Bihar | 3 | 4 | 4 | 1 |
| U.P. | 3 | 2 | 7 | 2 |
| T.N. | 3 | 4 | 9 | 4 |
© examsnet.com
Question : 112 of 155
Marks:
+1,
-0
Go to Question: