Test Index
SBI PO Prelims 1 Nov 2023 Paper
Show Para
Question Numbers: 45-50 Directions: - Read the following directions carefully and answer the following question.Line graph represents the total number of population visited in Museum A, B and C on Sunday.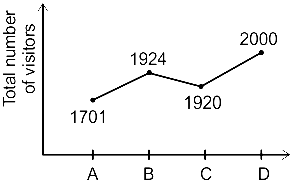 Table represent the number of male visited in Museum out of total population.
| Museum | Number of Male out of total People who visited in Museum |
| A | 2/9 |
| B | 11/13 |
| C | 13/16 |
| D | 19/40 |
© examsnet.com
Question : 49 of 100
Marks:
+1,
-0
Go to Question: