Test Index
SSC CGL 11 Aug 2017 Shift 1 Paper
Show Para
Directions (Q.Nos. 72-75) The bar chart given below shows the sales of 3 types of cars in the Indian automotive industry over 4 years. All the sales figures have been shown in terms of ‘000 units. 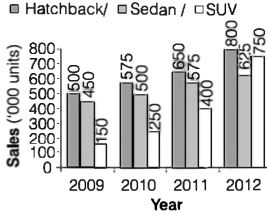
© examsnet.com
Question : 74 of 100
Marks:
+1,
-0
Go to Question: