Test Index
SSC CGL 17 Aug 2017 Shift 1 Paper
Show Para
Directions (Q.Nos. 72-75) The line graph shows annual profits (in ₹ lakhs) of a certain company from 2011 to 2016. Study the diagram and answer the following questions. 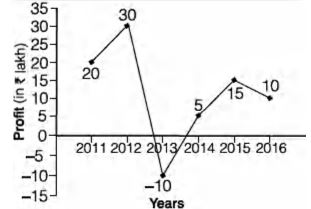
© examsnet.com
Question : 73 of 100
Marks:
+1,
-0
Go to Question: