Test Index
SSC CGL 7 Sep 2016 Paper
Show Para
Directions (72–75) : The following pie chart shows proportion of population of seven villages in 2009. Study the pie chart and answer the questions that follow : 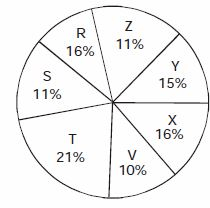
| Village | % of population Below Poverty Line |
|---|---|
| X | 38 |
| Y | 52 |
| Z | 42 |
| R | 51 |
| S | 49 |
| T | 46 |
| V | 58 |
© examsnet.com
Question : 75 of 100
Marks:
+1,
-0
Go to Question: