Test Index
SSC CHSL 5 Mar 2018 Shift 3 Paper
Show Para
The line graph shows the number of students admitted in the give year to a certain Uniiversity. Study the diagram and answer the following questions. 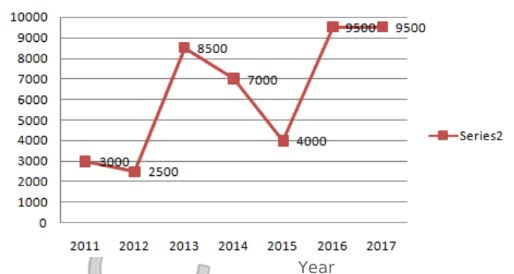
© examsnet.com
Question : 19 of 100
Marks:
+1,
-0
Go to Question: