Test Index
SSC CHSL 6 Dec 2015 Shift 1 Paper
Show Para
The bar graph provided below gives the data of the production of paper (in lakh tonnes) by three different companies X, Y, Z over the years. Study the bar chart and answer the following question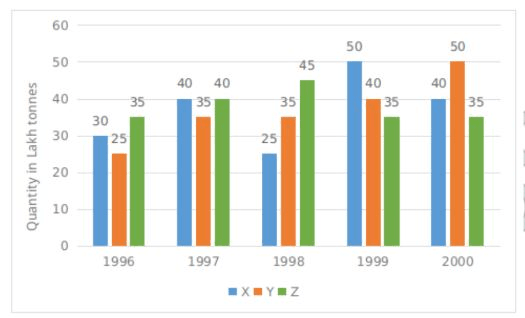
© examsnet.com
Question : 109 of 200
Marks:
+1,
-0
Go to Question: