Test Index
SSC CPO 1 July 2017 Shift 1 Paper
Show Para
Question Numbers: 122-125 Direction: The bar graph given below represents the total population and male population (in ‘000) of a city, during the period of 2013 to 2016.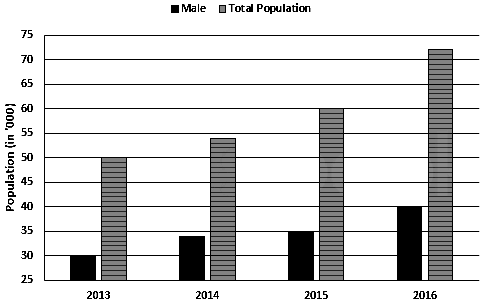
© examsnet.com
Question : 122 of 200
Marks:
+1,
-0
Go to Question: