Test Index
SSC CPO 2 July 2017 Shift 1 Paper
Show Para
Question Numbers: 146-150 Directions: The given pie chart shows the distribution (in degrees) of cars sold of different models by a company in 2015 - 16.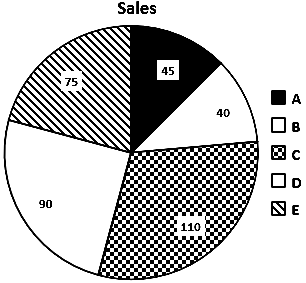
© examsnet.com
Question : 146 of 200
Marks:
+1,
-0
Go to Question: