Test Index
SSC CPO SI and ASI 2012 Paper
Show Para
Directions (Q. 142–145): A graph showing the price of rice in India during the years 2000 to 2003 is given below. Study the graph and answer the questions.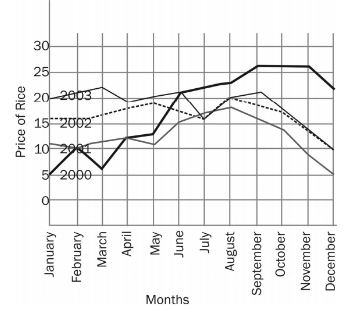
© examsnet.com
Question : 145 of 200
Marks:
+1,
-0
Go to Question: