Test Index
SSC CPO SI and ASI 2013 Paper
Show Para
Directions (Q. 146–150): Production of three different flavours of soft drinks X, Y and Z for a period of six years has been expressed in the following graph. Study the graph and answer the questions that follow.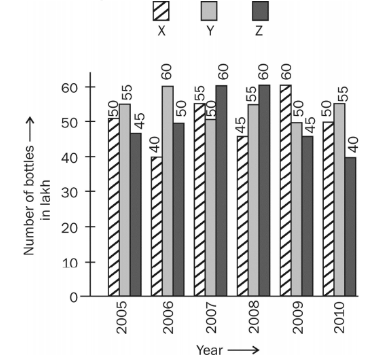
© examsnet.com
Question : 148 of 200
Marks:
+1,
-0
Go to Question: