Concept:For a first-order reaction
R→P at constant temperature, the concentration changes and the rate constant have characteristic graphical representations.
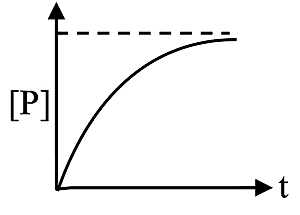
Explanation:Option A: Product concentration at time
t is
[P]t=[R]0(1−e−kt).
The graph of
[P] vs
t starts at zero and rises exponentially to approach
[R]0 asymptotically.
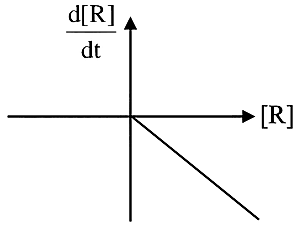
Option B: The rate law is
−dtd[R]=k[R].
Integrating gives
ln[R]=ln[R]0−kt, so
ln[R] vs
t is a straight line with slope
−k.
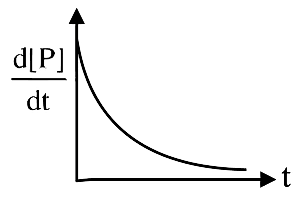
Option C: Rate of formation of product:
dtd[P]=k[R]=k[R]0e−kt.
Thus
dtd[P] vs
t shows an exponential decay from
k[R]0 to zero.
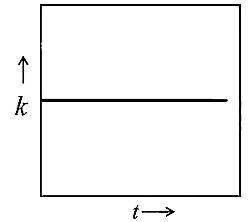
Option D: The rate constant
k depends only on temperature.
At a fixed temperature,
k is constant, so a graph of
k vs
t is a horizontal straight line.
Answer:Options A, B, C, and D are all correct.