Test Index
SBI PO 21 June 2014 Paper
Show Para
Directions (58-63) : In the following multiple bar diagram, the data regarding cost of production and sales revenue of the company XYZ in the given years have been given. Study the bar diagram carefully and answer the questions. 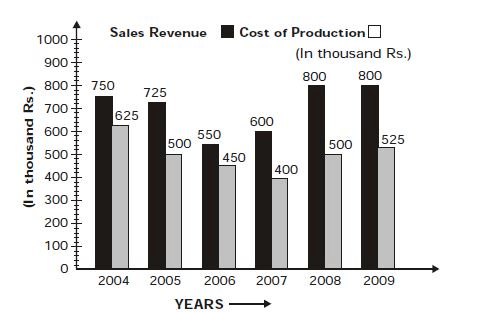
© examsnet.com
Question : 58 of 200
Marks:
+1,
-0
Go to Question: